Das Aussehen der gplot Diagramme in Fhem ist in der ~/fhem/www/pgm2/svg_style.css Datei ua. wie folgt definiert.
...

.l0 { stroke:red;     }  text.l0 { stroke:none; fill:red;     }

.l1 { stroke:green;   }  text.l1 { stroke:none; fill:green;   }

.l2 { stroke:blue;    }  text.l2 { stroke:none; fill:blue;    }

.l3 { stroke:magenta; }  text.l3 { stroke:none; fill:magenta; }

.l4 { stroke:brown;   }  text.l4 { stroke:none; fill:brown;   }

.l5 { stroke:black;   }  text.l5 { stroke:none; fill:black;   }

.l6 { stroke:olive;   }  text.l6 { stroke:none; fill:olive;   }

.l7 { stroke:gray;    }  text.l7 { stroke:none; fill:gray;    }

.l8 { stroke:yellow;  }  text.l8 { stroke:none; fill:yellow;  }
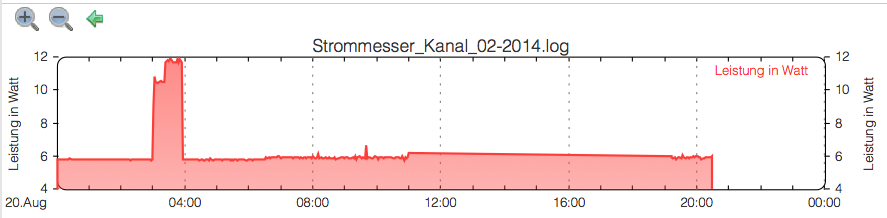
.l0fill{ stroke:#f00; fill:url(#gr_0); } text.l0fill{ stroke:none; fill:#f00; }
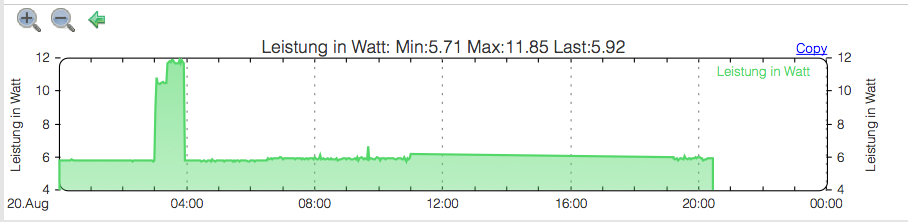
.l1fill{ stroke:#291; fill:url(#gr_1); } text.l1fill{ stroke:none; fill:#291; }
.l2fill{ stroke:#00f; fill:url(#gr_2); } text.l2fill{ stroke:none; fill:#00f; }
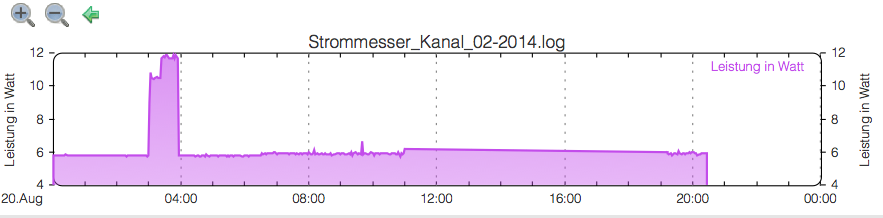
.l3fill{ stroke:#f0f; fill:url(#gr_3); } text.l3fill{ stroke:none; fill:#f0f; }
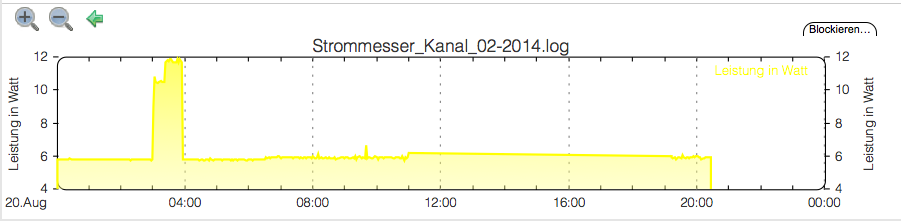
.l4fill{ stroke:#ff0; fill:url(#gr_4); } text.l4fill{ stroke:none; fill:#ff0; }
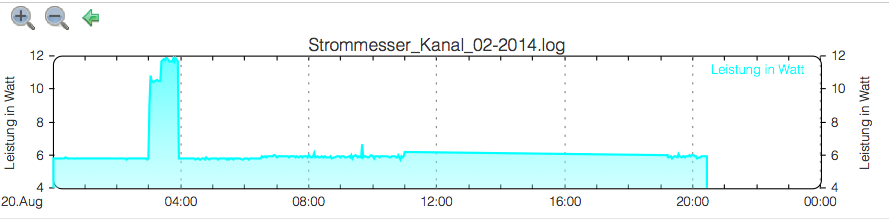
.l5fill{ stroke:#0ff; fill:url(#gr_5); } text.l5fill{ stroke:none; fill:#0ff; }
.l6fill{ stroke:#000; fill:url(#gr_6); } text.l6fill{ stroke:none; fill:#000; }
...
Hier mal jeweils ein Muster für alle .lxfill Styles am Beispiel des Standby Verbrauchs meines TV und Recorder:
plot "
plot "
plot "

plot "
plot "
plot "
plot "
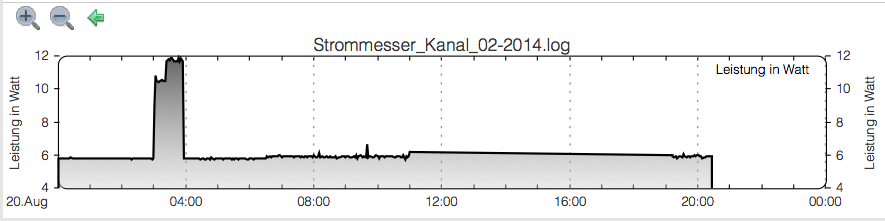
Die .lx sind ja im Klartext oben zu sehen. Hier reicht wohl ein Beispiel für schwarz:
plot "
